Introduction
Ignoring key metrics in your content syndication campaign leaves you driving blind to what matters in your strategy. It’s like looking at a map, you may be moving but lacking a clear direction.
To effectively gauge your content syndication campaign you need to focus on the right metrics to guide your decision and drive meaningful results. This is why we decided to round up key metrics you need to measure the success of your B2B Content Syndication.
Key B2B Content Syndication Metrics For Measuring Success
These key metrics will help you double down on the right approach towards driving your expected result. Let’s dive in.
Lead generation metrics
The primary goal of content syndication is to generate high–quality leads who are more likely to follow the sales funnel and purchase a product or inquire about your service. That’s why focusing on metrics that directly reflect ROI, conversions, and overall campaign effectiveness is crucial for generating quality leads.
Here are the lead generation metrics to track.
Marketing Qualified Leads (MQL)
MQL are prospects signalling they are ready to buy your product —opening the marketing email, signing up for something or attending a webinar.
They want to be clarified about specific details, waiting for the right timing, or anticipating a potential discount. One great thing about MQL is that there is little need to do hard selling as they already believe in the integrity of your product.
Hence, further nurturing through targeted campaigns by your marketing team, with the right approach, can smoothly transition the qualified leads to your sales team for quick conversion.
Sales Qualified Leads (SQL)
Once MQL have shown their potential to take action, the ability to purchase is carefully evaluated. SQL provide a measure of potential leads vetted by the sales team and are deemed ready for engagement and a sales pitch.
These leads have shown a strong interest in your product or service and meet the four key BANT criteria—budget, authority, need, and timeline, making them qualified candidates for conversion into paying customers.
Since SQL lean towards BOFU content such as product demos, customer testimonials, and detailed comparisons, tailoring your content to these preferences will guide them effectively through the sales funnel.
Cost Per Lead (CPL)
CPL measures the average cost of every dollar spent in acquiring a new lead through your content syndication campaigns. It’s calculated by dividing the total campaign cost by the number of leads generated.
This metric allows you to compare the effectiveness of different syndication platforms or content pieces.
CPL can vary significantly depending on the industry and specific lead generation campaign. A good rule of thumb is to aim for a low CPL. A lower CPL indicates a cost-effective lead generation strategy, while a higher CPL signals the need to adjust your lead generation strategy—tweak your content, targeting, or chosen platforms.
This balance is key to optimizing your budget and maximizing the return on your investment.
Engagement Metrics
How well is your content resonating with your target audience?
The engagement metric provides valuable insights into the performance of your syndicated content, enabling you to make data-driven decisions to optimize your campaigns.
Click-through Rate (CTR)
Engagement starts with a click. If your target customers don’t click they won’t proceed to your landing page and make a purchase.
CTR measures the percentage of people who view your syndicated content from the source platform and end up clicking it. It also shows how effectively your CTAs prompt users to take an action— purchase, register, or download a resource.
A higher CTR signals that your content resonates with your target audience, encouraging them to engage further.
Time On Page
8 seconds. That’s all you need to keep your audience engaged.
A longer engagement period indicates that your content is perceived as valuable, captivating, and compelling increasing the likelihood of converting visitors into leads. Tracking this metric allows you to refine and improve future content to ensure sustained engagement.
Bounce Rate
The bounce rate represents the number of visitors who view your content on syndication platforms and leave without clicking anything or taking action. According to Databox, the average bounce rate for a B2B website is around 60%.
This could be one of many reasons. Either you are not distributing the right content, not syndicating your content on the right platform or your content doesn’t give value.
However, the cure to a high bounce rate will be to increase the engagement on your page (with the aid of internal links, CTA, etc), and increase page speed to match user experience. A lower bounce rate suggests that your content captures the interest and encourages visitors to engage more with your site.
Inbound web traffic
Inbound web traffic tracks the number of visitors who land on your website after clicking on your syndicated content.
When your content is targeted and valuable, it can effectively drive traffic back to your domain, where conversions happen.
Inbound web traffic assesses the reach and visibility of your content across various channels and platforms. Increased inbound traffic means more exposure to your content, leading to a greater potential for generating leads and conversions.
Conversion Metrics
This metric answers how effective your content is in driving desired actions.
Lead-to-Customer Conversion Rate
The leads-to-customer conversion rate shows the efficiency of your syndicated content in generating leads and guiding them to become paying customers. This metric directly connects your content distribution efforts to revenue generation, justifying money’s worth and helping you make changes where necessary.
To calculate this rate, divide the number of customers acquired by the total number of leads generated, then multiply by 100.
Note: Conversion rates vary by industry and product category.
For example, a lightweight business management SaaS product might have a short sales cycle with a single buyer while a new data centre or large cloud deployment might involve a lengthy sales cycle with multiple decision-makers.
Whatever the case, this approach enables you to track how accounts move through your pipeline as part of a lead-generation campaign, providing a clear measure of success.
SQL to Customer Conversion Rate
SQL to customer conversion rate is a sales metric that measures the percentage of sales-qualified leads that convert to customers. It is calculated by dividing the number of sales by the number of SQLs and multiplying the result by 100
The average SQL-to-customer conversion rate is just over 22% for all industries, but this number can vary based on the specific industry
Landing Page Conversion rate
Landing page conversion refers to the percentage of visitors who complete a desired action, such as signing up for a product, downloading a whitepaper, or making a purchase. According to a study by Econsultancy, the average conversion rate for B2B companies is around 2.23%—serving as a benchmark for assessing the success of your content syndication campaigns.
However, Improving conversions can be a slow process, as you’d need to constantly a/b test different elements to see what is generating better results.
Here are some ways to improve it:
- Make the headline short, sweet and eye-catching.
- Powerful CTA
- Offer valuable proposition.
To calculate it, divide the number of qualified leads by the total number of website visits, then multiply by 100.
This percentage gives you a clear measure of your landing page’s effectiveness.
Best practices for measuring success in B2B syndication campaigns
Practicing these strategies ensures your B2B syndication campaign is effectively tracked, analyzed, and optimized for optimum impact.
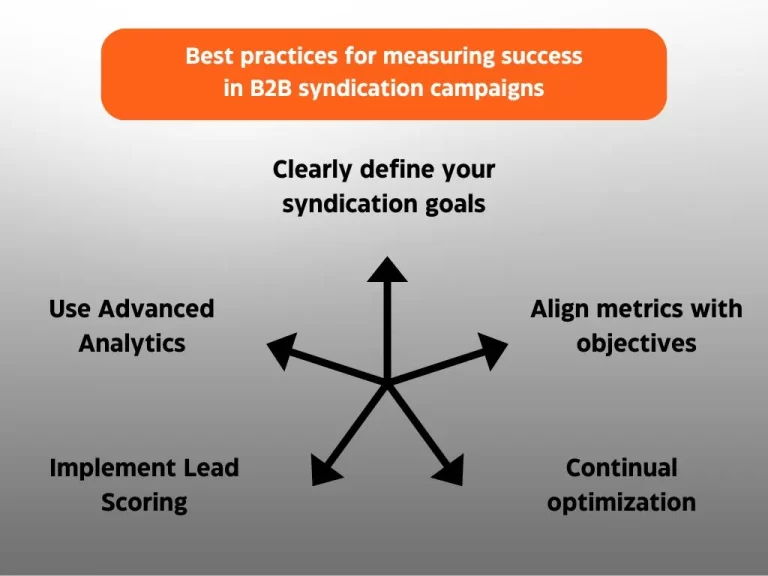
Clearly define your syndication goals
Tracking the right metrics will be impossible if you don’t have a clear picture of your destination. What do you aim to achieve?
Answering this question will serve as a roadmap to set Specific, Measurable, Achievable, Relevant and Timely (SMART) goals. However, these goals require unique strategies, content types, and performance indicators.
Identify areas for improvement and make adjustments.
Align metrics with objectives
When running a content syndication campaign to generate leads, you notice a high click-through rate (CTR) with low lead conversion. In such cases, consider refining your targeting, call-to-action, and landing page to realign your strategy.
Measuring too many metrics without a clear focus can lead to data overload, making it difficult to derive meaningful insights. Start by clearly defining the objectives of your content syndication campaign and select metrics that directly align with those goals. This ensures you’re measuring the right factors and can accurately assess the success of your efforts.
As objectives shift over time, your metrics should adapt accordingly to goals so you can make data-driven decisions and optimize your content syndication strategy to improve ROI.
Implement Lead Scoring
Lead scoring is one essential tool for evaluating the quality of leads generated through content syndication. It measures a lead’s interest and readiness to buy by assigning points based on engagement metrics like eBook downloads, webinar attendance, or time spent on landing pages.
Integrating lead scoring into your content syndication strategy enhances your ability to assess campaign effectiveness, refine targeting, and generate high-quality leads that align with your business goals.
Continual optimization
Content syndication is not a one-time effort. It is continuous. As your campaign unfolds, there is a need to consistently refine and improve your strategies based on data-driven insights to enhance performance and lead generation.
For example, if the CTR is high but conversions are low, you might need to adjust your landing page or call-to-action to better resonate with your audience. Also, A/B testing is another way to determine what resonates best with your audience.
Moreover, optimizing your syndication channels based on performance ensures that you’re investing in the platforms that deliver the highest ROI. By iterating on these elements, you can fine-tune your approach to target the right audience more effectively and improve overall campaign performance.
Use Advanced Analytics
More than just conversion rates, CTR and CPL, tools like Google Analytics 360 and Hubspot dive deeper into metrics such as channel effectiveness, and lead behaviour. It also helps identify the specific content or channels the prospect engages more with. This way you get to tailor your content and distribution strategies to better meet the needs of your audience.
For instance, examining metrics like time spent on content and the sequence of interactions before conversion helps pinpoint what drives engagement and successful conversions.
By leveraging these insights, you can optimize future content creation and syndication strategies, ensuring they are more aligned with audience preferences and market dynamics.
Choosing the Right B2B Content for Syndication
Guarantee Your Success with Salesbridge B2B Content Syndication Solution
Finding out what’s not working in your content syndication campaign proves a need for optimization. From conversion rate to lead generation metrics and engagement metrics, knowing what to improve involves diving deeper into the nitty-gritty of your campaigns. With our content syndication process at The Salesbridge, aimed at generating leads for your business, be sure to get value for your money’s worth.